
Prof. Dr. med. Dietrich Tönnis
Sammlung wissenschaftlicher Arbeiten und Vorträge zur Orthopädie
Evaluation of Normal Values of the Hip and the Prognosis of Deformed Joints
© Prof. Dr. med. Dietrich Tönnis
By clicking on a figure an enlarged version of the figure will appear. At the end of the page you will find a PDF version of the paper.
In the subject of this paper, I have been engaged from my first orthopaedic investigation, up to the latest. The knowledge of normal and pathologic values of the hip we need to start and to end conservative or operative therapy. At the end we want to achieve a normal joint. How can we define a normal hip as far as deformations are concerned? A normal joint should be free of pain and function well until 65-70 years of age.
And what is a normal joint in childhood? The answer is: a joint, that is normal at the end of growth, when it is compared with the normal values of adults.
Let us first talk about the evaluations in children. When I went into Orthopaedics 1960 and I asked "Shall we give an abduction-pillow to this child?" or "What is the normal acetabular index at this age?", the answer frequently was "You must decide that with your 'clinically experienced eye'."
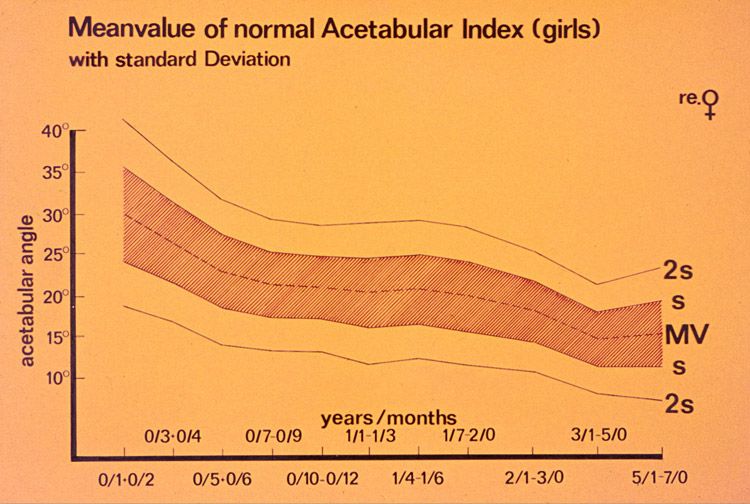 This was the technique which we used to compile together with Brunken a normal material out of 2294 acetabular indices. Above the upper one standard deviation from the mean value, we included also the doubtful extreme values, in which we could not make a decision.
Then we reinvestigated the children at the age of 5-7 years and found that joints below the upper one standard deviation stayed in this area in the following years.
 Between the first and second upper standard deviation, there was an area where we could not say, whether this were just extreme values or already pathological ones. So we reinvestigated them after 5-7 years and found that almost 40% of the angles decreased and were found then in the normal range below 1 SD. Another 40% remained at extreme values between 1 and 2 SD. And 19% of the angles increased and were found above the 2 SD line.
Exner and Kern have reinvestigated these joints at the age of 18 years in avarage. They found the CE-angles normal in 71%, the Ullmann-Sharp angle normal in 82% and the Hip Value - a combination of three measurements - normal in 90%. In spite of this spontaneous improvement between 71 and 90%, we have to realize, that there is a percentage between 10 and 30 that needed treatment.
In these extreme values the development can not be foreseen safely and abduction devices should be given in the first half year where the healing is most rapidly. Joints between 1 and 2 SD and slightly above should either be treated or controlled.
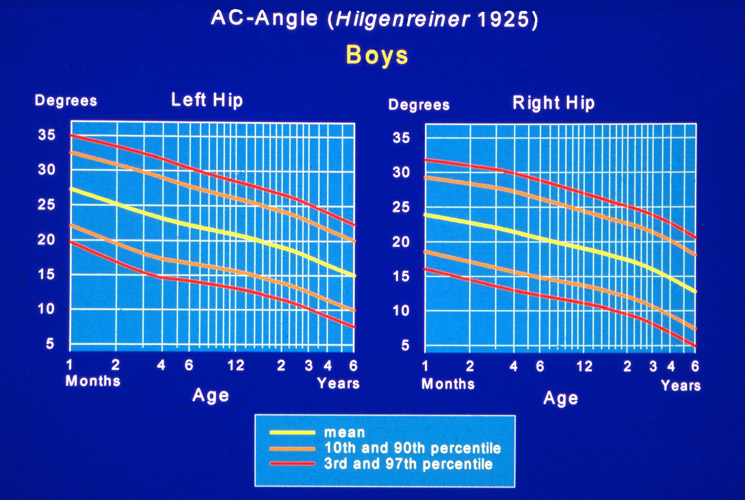
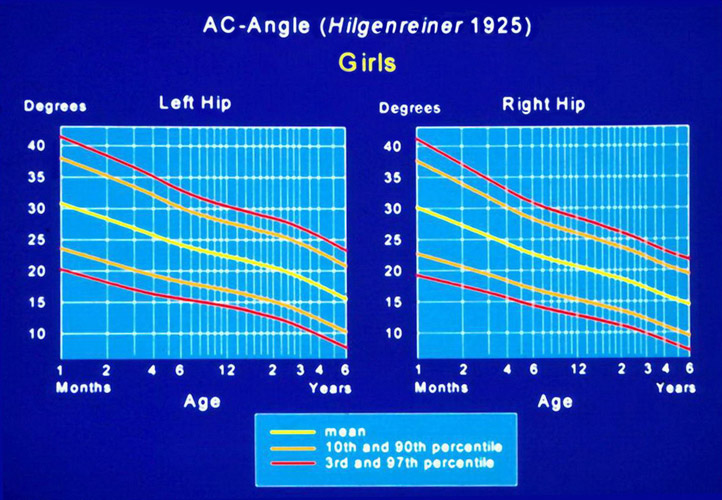
Together with Neidel we have introduced percentil-graphics for girls and boys and for the left and right hip, in which we can check the development.
The first one who reported measurements of normal and dysplastic acetabula by reinvestigation of childrens hips in adulthood and before and after the apearance of osteoarthro- sis, was our Swedish colleague Gunnar Wiberg in 1939. You all know his CE angle. He found in the same way a critical zone between definitely normal and definitly pathological. CE angles of more than 25° he considered as normal, angles below 20 as pathological.
And then he wrote "As yet it is impossible to say whether the angles between 20 and 25 degrees denote normal or pathologic conditions in the joint."
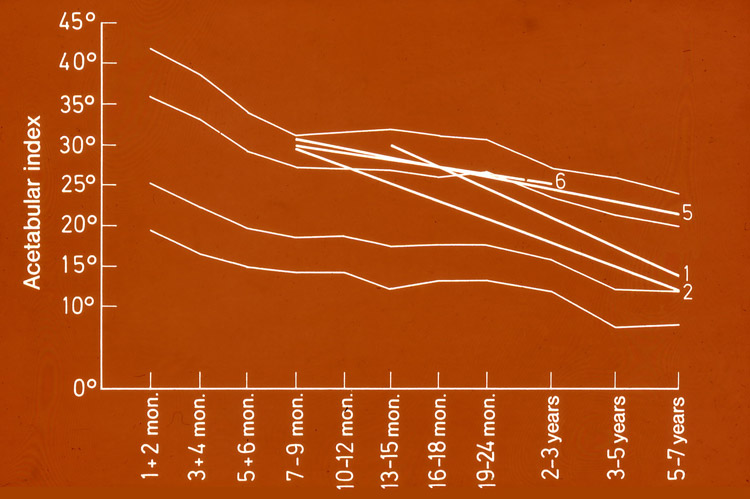
We introduced tables with moderately and severely dysplastic joints of girls and boys up to 7 years (Tab. 1).
| Age | Girls | Boys | |||||||
|---|---|---|---|---|---|---|---|---|---|
| (Years/Months) | slight dysplastic (s) | heavy dysplastic (2s) | slight dysplastic (s) | heavy dysplastic (2s) | |||||
| right | left | right | left | right | left | right | left | ||
| 0/1 + 0/2 | 36 | 36 | 41.5 | 41.5 | 29 | 31 | 33 | 35 | |
| 0/3 + 0/4 | 31.5 | 33 | 36.5 | 38.5 | 28 | 29 | 32.5 | 33.5 | |
| 0/5 + 0/6 | 27.5 | 29.5 | 32 | 34 | 24.5 | 27 | 29 | 31.5 | |
| 0/7 - 0/9 | 25.5 | 27 | 29.5 | 31.5 | 24.5 | 25.5 | 29 | 29.5 | |
| 0/10 - 0/12 | 24.5 | 27 | 29 | 31.5 | 23.5 | 25 | 27 | 29 | |
| 0/13 - 0/15 | 24.5 | 27 | 29 | 31.5 | 23 | 24 | 27.5 | 27.5 | |
| 0/16 - 0/18 | 24.5 | 26 | 29 | 30.5 | 23 | 24 | 26.5 | 27.5 | |
| 0/19 - 0/24 | 24 | 25.5 | 28 | 30.5 | 21.5 | 23 | 26.5 | 27 | |
| 2/0 - 3/0 | 22 | 23.5 | 25.5 | 27 | 21 | 22.5 | 25 | 27 | |
| 3/0 - 5/0 | 18 | 21 | 22.5 | 25.5 | 19 | 20 | 23.5 | 24 | |
| 5/0 - 7/0 | 18 | 20 | 23 | 23.5 | 17 | 19 | 21 | 23 | |
Let us now come to the evaluation of the normal angles in adults.
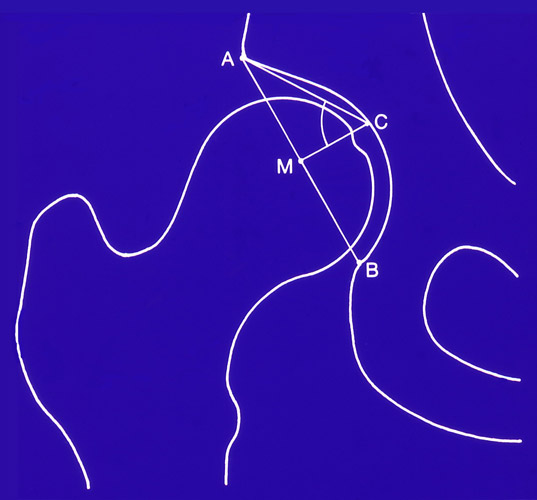 For our investigation together with Busse and Brückl et al. we measured first the ACM angle of Idelberger and Frank. It is an approximate measure of the morphology of the acetabulum and its depth. It can be compared with the acetabular quotient, but in the ACM angle the width is measured from the acetabular edge to the lower posterior end of the lunate figure. This depth is more realistic then measuring to the tear drop figure.
With the formula 200 cos (ACM) we can figure that an acetabulum with an angle of 45° corresponds in 100% to a hemisphere, with an angle of 50°only in 83%.
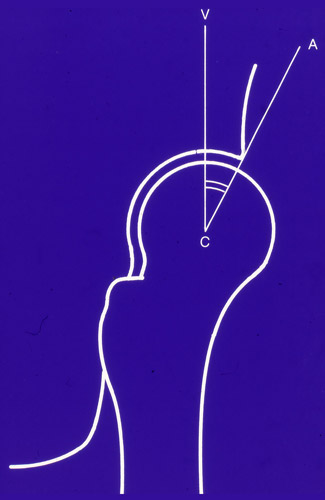
 The CE angle was used to provide us with an approximate measure of the utilization of the acetabulum. It tells us the percentage of a hemisphere that covers the cranially directed portion of the femoral head.
The formula is 100 x 1+ sin CE) / 2%.
The CE angle was used to provide us with an approximate measure of the utilization of the acetabulum. It tells us the percentage of a hemisphere that covers the cranially directed portion of the femoral head.
The formula is 100 x 1+ sin CE) / 2%.
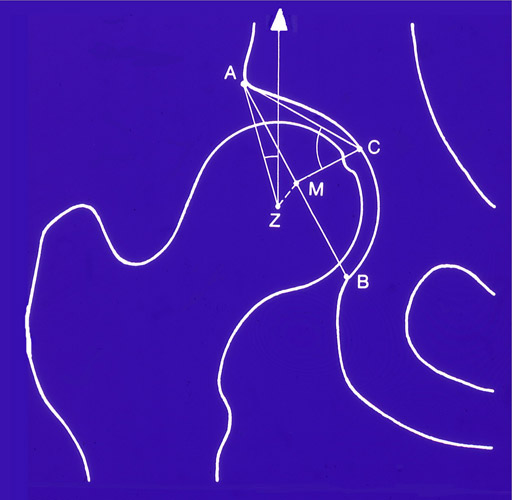
The letter Z is the center of the femoral head and the letter M the center of an dysplastic acetabulum. The more shallow it is, the greater the distance between M and Z. We call this measurement the decentration-distance. These 3 measurements were combined in one - the socalled Hip Value. We found out, that this gives us more information about the morphology of a joint than a single measurement.
817 radiographies of hip joints have been evaluated. The age of the patients ranged from 21 to 50 years.
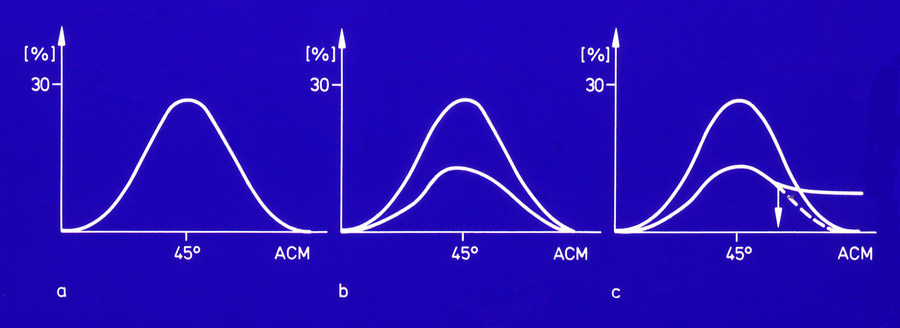
Here we can see that it is possible to define graphically the borderline of normal and pathological values. In the left figure the distribution of ACM angles in normal asymptomatic hips is shown. In the figure in the middle, a smaller population of osteoarthrotic hips without dysplasia is added.
In the last figure at the right, hips with osteoarthrosis due to dysplasia are also included. Here we recognize the statistically defined boundary at which dysplastic osteoarthrotic hips diverge from hips with osteoarthrosis due to other causes. Following the curve to the right, the number of not deformed joints is decreasing and that of the dysplastic joints prevailing. Significance for this borderline was proved with the Chi square test.
After this evaluation the borderline of normal hips is 30° for the CE angle, 49° for the ACM angle, 6 mm for the decentration distance MZ and 16 for the Hip Value. That there is a boundary also on the opposite side, the deep acetabulum and the protrusio acetabuli, we shall discuss later.
The mean value for the normal ACM angle at the age of 21 to 50 years was 45.0° +/- 3.2° (n=358), for the CE angle 35.7° +/- 6.5° (n=358) and for the decentration distance MZ 3.9 mm +/- 1.7° (n=358).
When we introduced in our department the acetabular rotation by triple pelvic osteotomy for dysplastic joints, we had another possibility of controlling normal joint measurements. Optimal values, we thought, would go along with the highest percentage of joints free of pain postoperatively.
Reinvestigations were performed in 216 joints operated between 5 and 16 years ago (avarage 7.7 years) (published 1994). We used somewhat different measurements that are easy to check by fluoroscopy during operation and in 2 planes.
| WBZ angle | No pain (%) | 95% confid. intv. |
|---|---|---|
<-5 |
50.0 |
|
-5 - +5 |
74.1 |
|
6 - 10 |
66.7 |
|
11 - 15 |
45.0 |
tendency |
16 - 25 |
44.7 |
significant |
26 - 55 |
52.9 |
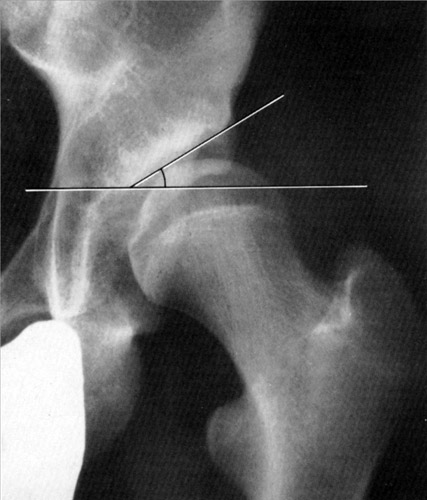
The angle of the weight-bearing - or loading zone - at the acetabular roof, after Bombelli, is shown in Fig. 8, postoperative angles are shown in groups at Tab. 2. At angles -5 to +5° , so practically at zero, we find with 74.1 %, the highest percentage of joints free of pain. The 95% confidence intervall is present between this group and 16 - 25°. At the group 1 1- 15° a statistical tendency of difference is given. At 6 - 10° the percentage is lower with 66° compared to 74%, but there is no statistical difference. v. Torklus has measured this angle in a greater normal material and found +-9° as the normal range. These findings are apparently identical.
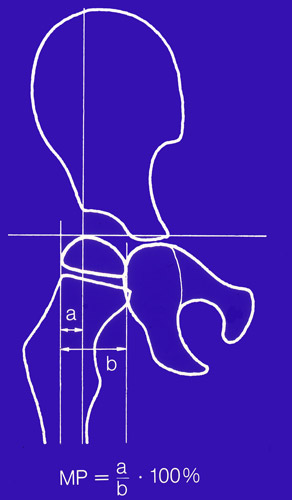 The extrusion index or migration percentage after Reimers :
A divided by B, multiplied by hundred, gives us the percentage of the femoral head that is uncovered.
| Migration (%) | No pain (%) | 95% confid. intv. |
|---|---|---|
< 10 |
55.6 |
significant |
10 - < 15 |
87.9 |
|
15 - < 20 |
55.3 |
significant |
20 - < 25 |
58.6 |
tendency |
25 - <35 |
42.3 |
significant |
> 35 |
56.3 |
tendency |
Here, the optimal percentage of 87.9% joints free of pain, is found at 10 to 15% extrusion. The neighbouring group with the higher extrusion of 15-20% and also the one with a smaller extrusion of 10% and less have only 55% free of pain and the 95% confidence intervall is present to the optimal group 10-15%. It is remarkable to see, how quickly we can overcorrect the acetabular cover and increase the rate of pain by a socalled deep acetabulum or coxa profunda. This measurement has not such a wide range of normal values as the weightbearing zone.
| CE angle | No pain (%) | 95% confid. intv. |
|---|---|---|
< 10 |
57.6 |
|
10 - < 20 |
40.0 |
significant |
20 - < 25 |
62.5 |
|
25 - < 30 |
50.0 |
|
30 - < 35 |
78.1 |
tendency |
35 - 40 |
65.5 |
|
> 40 |
63.6 |
The optimal angle group of the CE angle , as seen in Tab. 3, is 30-35° with 78% of the joints free of pain. The 95% confidence interval is present only to the group of angles from 10° to 19°. It seems possible that the normal range is larger here .
Also the higher group of 35 to 39° shows no significant difference. This corresponds with other authors and our earlier investigation with Busse of a median value of 35 to 37 degrees. And the larger normal range of this angle corresponds with the findings of Wiberg from 25-40° with a "no men’s land" between 20 and 25°.
 The VCA angle of Lequesne and de Seze is important, because it is the only radiography taken from lateral and measuring the anterior coverage.
It is also called the anterior CE angle. Lequesne has described the normal value to be 25° and more and equivalent to the CE angle, and we have tried to direct the acetabulum to this angle.
The VCA angle of Lequesne and de Seze is important, because it is the only radiography taken from lateral and measuring the anterior coverage.
It is also called the anterior CE angle. Lequesne has described the normal value to be 25° and more and equivalent to the CE angle, and we have tried to direct the acetabulum to this angle.
| VCA angle | No pain (%) | 95% confid. intv. |
|---|---|---|
< 10 |
39.3 |
significant |
10 - < 20 |
50.0 |
tendency |
20 - < 25 |
56.0 |
|
25 - < 30 |
70.0 |
|
30 - < 35 |
77.3 |
|
35 - < 40 |
80.0 |
|
> 40 |
68.2 |
But as this table shows, all the angles between 25 and 39° are free of pain in 70 to 80%. The group from 35 to 39 has only 10 joints and is probably not representative. The 95% confidence interval is present only when the group from 30 to 34° is compared with the group of angles below 10° and as a tendency in the group from 10-20°. In general this angle resembles in its mean value and the wider range very much the lateral CE angle of Wiberg.
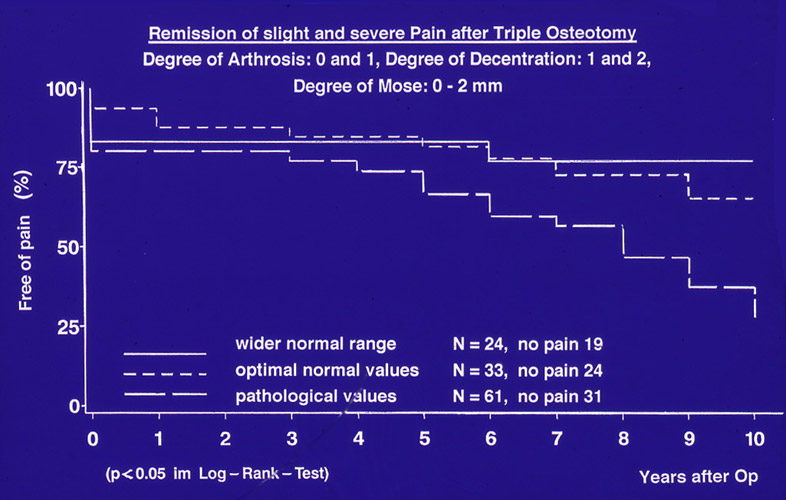 A further proof we found in surviving rate curves of triple osteotomies, when we investigated the remission of pain and compared angles that had not been normalized completely with the optimal angles and the wider range of normal angles.
The optimal angles were those with the highest relief of pain, 30-35° for the CE and the VCA angle, -5 to +5° for the angle of the loading zone and 10-15° of the extrusion percentage. The wider range of normal angles extended from 25-39° for the CE and VCA angle, -9 to +9° for the loading zone angle and 5 to 19% for the extrusion index.
Between the optimal and the wider range of normal angles there was no significant difference in the surviving rate curves and they were decreasing only slightly. In joints with angles outside the normal range, that means with insufficient or too much rotation of the acetabulum, there was an earlier and constant remission of slight or severe pain, here the lowest curve.
Overcorrection produces a so called deep acetabulum, similar to the protrusio acetabuli, which is a prearthrotic deformity too.
| Degrees | 1 normal |
2 mildly pathological |
3 severely pathological |
4 extremely pathological |
|---|---|---|---|---|
CE angle |
≥ 30 |
20 - 29 |
5 - 19 |
< 5 |
VCA angle |
≥ 25 |
20 - 24 |
5 -19 |
< 5 |
ACWZ angle |
≤ 9 |
10 -15 |
16 - 25 |
> 25 |
Reimers Ind. |
≤ 15 |
16 - 25 |
26 - 40 |
> 40 |
These investigations, we believe, demonstrate the importance of a more exact knowledge of normal and pathological angles and their precise correction. For a more differentiated reinvestigation we inroduced to the normal values of the hip 3 degrees of deviation.
So far we have considered only the angles of two planes of the hip joint. By computertomographies we get pictures of the horizontal plane in which we can measure the anteversion of the femur (FA) and the acetabulum (AA). In the past mainly the increased anteversion of the femur was investigated. Some authors found a correlation with osteoarthrosis, others did not. Huguenin and Bensahel saw children at the age of about 10 years with decreased femoral anteversion complaining of pain in so young years already.
We published a study in 1991 documenting decreased femoral anteversion as a cause of a limited range of internal rotation of the hip and increased external rotation, pain and later arthrosis of the hip.
| 1. Developmental decrease of AA and FA without other deformities |
| 2. Acetabula with CE angles 20 - 39 |
| 3. Moderate and silent SCFE and pistol grip deformities |
| 4. Coxa vara and Coxa valga |
In the last years we evaluated femoral and acetabular anteversion in computertomographies of 356 hips of adolescents and adults. The decrease of anteversion was either developmental from birth and childhood, or going along with a coxa vara or a pistol grip deformity seen in asymptomatic minimal slips of the capital femoral epiphysis. Moderate slips have been evaluated too, also moderately deep acetabula with CE angles from 40-44°. Only hip dysplasia with a CE angle below 20° was evaluated separately. Anteversion angles of 15-20° were assumed as normal in acetabular and femoral anteversion and tested during the investigation as group 1.
| Group | (AA/FA) | % | Total |
|---|---|---|---|
1 |
(-3 / -3) |
9.6 |
26 |
2 |
(-2, -3 / -2, -3) |
28.7 |
78 |
3 |
(-2, -3 / +2, +3) |
8.8 |
24 |
4 |
(+2, +3, / -2, -3) |
19.5 |
53 |
5 |
(-2, -3 / 1) |
4.8 |
13 |
6 |
(1 / -2, -3) |
18.4 |
50 |
7 |
(1 / 1) |
2.6 |
7 |
8 |
(+3 / +3) |
1.8 |
5 |
9 |
(+2, +3 / +2, +3) |
5.9 |
16 |
Decreased angles were divided in group -2 and -3 and increased angles in group +2 and +3. A severely decreased anteversion has angles below 10°, a moderately decreased: angles between 10 and 14° as shown in Tab. 8.
Acetabular and femoral anteversion can be combined in a joint quite differently. When both are decreased or increased, the deformation is worse. When decreased and increased angles are combined a compensation is seen. The femur is here of more influence.
McKibbin has described an instability test, in which he counted the degrees of acetabular and femoral anteversion together. At 50 - 60 degrees there was a marked instability in the joint. We introduced here the normal angle group and the deviation degrees by doubling the angles. The frequency of the groups is seen here too. Decreased anteversion of acetabulum and femur is much more symptomatic, than increased anteversion, as you see.
| Group | Grade of Anteversion (Acetabular/Femoral) |
No. of Patiens (n=103) |
No. of Hips (n=178) |
Internal Rotation* (degrees) | External Rotation* (degrees) | P Value** |
|---|---|---|---|---|---|---|
| *The data are given as the average and the standard deviation ** Wilcoxon rank-sum test |
||||||
1 |
(-3 / -3) |
17 |
20 |
17 ± 11.2 |
40 ± 9.9 |
0.00001 |
2 |
(-2 -3 / -2 -3) |
47 |
59 |
18 ± 11.7 |
44 ±13.9 |
0.00000 |
3 |
(-2 -3 / +2 +3) |
10 |
13 |
50 ± 21.4 |
30 ± 16.6 |
0.00684 |
4 |
(+2 +3 / -2 -3) |
24 |
30 |
25 ± 20.0 |
40 ± 13.0 |
0.00067 |
5 |
(-2 -3 / 1) |
8 |
9 |
21 ± 19.6 |
44 ± 16.3 |
0.05469 |
6 |
(1 / -2 -3) |
25 |
28 |
18 ± 14.5 |
46 ± 15.4 |
0.00000 |
7 |
(1 / 1) |
3 |
3 |
22 ± 33.3 |
23 ± 16.1 |
1.00000 |
8 |
(+3 / +3) |
3 |
5 |
46 ± 27.2 |
42 ± 5.7 |
0.75000 |
9 |
(+2 +3 / +2 +3) |
7 |
11 |
42 ± 19.9 |
43 ±8.1 |
0.97656 |
Tab. 9 presents the range of internal and external rotation in the different groups. In group -2 and -3 the internal rotation is decreased to about 17°, the external rotation increased to 46° in group -3 and 39 ° in group -2. These differences are statisticaly significant and this is typical for decreased anteversion of acetabulum and femur.
In the normal group 1, as it should be, internal and external rotation are almost equal with 33 and 36°. In the joints with increased anteversion, which are counted together because of the smaller number, we do expect that internal rotation is increased in comparison to external. However, the difference is not very large here and significance is not given.
| Index | No Pain | Pain | Number | Lower border | Upper border |
|---|---|---|---|---|---|
| Chi-square: Value 10.633, p=0.014 The 95% Confidence limits with very little overlapping between index < 20 and 30 - 40 (normal) are considered significant for decreased AV and AT. |
|||||
< 20 |
27.5 |
72.6 |
102 |
62.8 |
80.9 |
20 - < 30 |
45.2 |
54.8 |
62 |
41.7 |
67.5 |
30 - 40 |
48.2 |
51.9 |
54 |
37.8 |
65.7 n.r. |
> 40 |
25.0 |
75.0 |
32 |
56.6 |
88.5 |
In Tab. 10 the correlation between different anteversion index groups and pain is shown, in addition the 95% confidence intervals. Pain is significantly increased in the extremely diminished anteversion group of index <20 and the most increased anteversion of > 40. The 95% confidence interval is sufficient for the decreased anteversion, and shows a tendency only for pain at increased antversion, because of the smaller number of joints.
| Index | No Arthrosis | Arthrosis | Number | Lower border | Upper border |
|---|---|---|---|---|---|
| Chi-square: Value 5.254, p=0.154 The 95% Confidence limits with very little overlapping between index < 20 and 30 - 40 (normal) can be considered significant for decreased AV and AT. |
|||||
< 20 |
59.2 |
40.8 |
103 |
31.2 |
50.9 |
20 - < 30 |
70.4 |
29.6 |
71 |
19.3 |
41.6 |
30 - 40 |
75.4 |
24.6 |
65 |
14.8 |
36.9 n.r. |
> 40 |
66.7 |
33.3 |
36 |
18.6 |
51.0 |
Table 11 is investigating the correlation of anteversion and osteoarthrosis. As it was demontrated for pain, the extremly decreased anteversion with index <20 shows osteoarthrosis in 40.8%, with increased anteversion there are only 33.3%. The 95% confidence interval test shows only slight overlapping when group <20 is compared with the normal anteversion group 30-40. Therefore, the correlation of severely decreased anteversion and osteoarthrosis appears proven. I have to add, that we exccluded patients with severe arthrosis where the range of movement was already diminished in total. Otherwise the percentage of arthrosis would be higher.
It is interesting to see the combination of decreased and increased acetabular and femoral anteversion in Tab. 8. We checked 9 possibilities in these symptomatic joints. Most frequent with 28.7% was group 2 with a moderate and severe decrease of anteversion, as well for acetabular and femoral anteversion. The next following percentage of 19.5% was found in group 4. Here is an increase of acetabular anteversion +2 and +3 confronted with the groups -2 and -3 of femoral anteversion. Decreased femoral anteversion is more frequent than decreased acetabular anteversion and has more clinical consequences. This is important for the indications of rotational osteotomies to correct decreased femoral anteversion. For severe retrotorsion of the acetabulum we perform triple pelvic osteotomies to rotate the acetabulum to normal values.
| Deformity Joints | Anteversion Acetabulum | Anteversion Femur |
|---|---|---|
Hipdysplasia (n=32) |
29% |
59% |
Deep acetabulum (n=40) |
25% |
61% |
Epiphysiolysis (n=33) |
27% |
77% |
Coxa vara (n=39) |
5% |
77% |
Coxa valga (n=21) |
29% |
33% |
Finally, let us see which deformities go along with decreased and increased acetabular and femoral anteversion in a symptomatic clincal material (Tab. 12). In hip dysplasia and the deep acetabulum (CE 40-45) femoral anteversion was severely decreased (index -3) in about 60% and the acetabular anteversion in 29 and 25 %.
In symptomatic and asymptomatic SCFE (sliped capital femoral epiphysis) femoral anteversion was decreased in 90.3%, 77% of these showed the extreme decrease of group - 3. But in 48% a severe or moderate decrease was also present at the acetabular anteversion. This has not been reported so far.
Coxa vara presents also a very high percentage of severe decrease of femoral anteversion with 76.9% for group -3, coxa valga only 33.3 %.
At the end of this paper I try to answer the question: what is the prognosis of differently deformed hip joints? Murphy, Ganz and Müller have published a follow-up of patients with total hip replacement where they investigated the contralateral hip. The initial radiographic findings in 74 patients, in whom advanced osteoarthrosis later developed in the contralateral hip, were compared with 43 patients who had reached the age of 65 years without having had severe oteoarthrosis of the contralateral hip.
No patient in whom the hip functioned well until 65 years had a CE angle of less than 16°, an acetabular index of the weightbearing zone of more than 15° and uncovering of the femoral head of more than 31%. These values surpass even our normal values of a wider range, but it is interesting to know.
In a study of 1979 with Thiele et al. we investigated 198 joints with developmental hip dysplasia, age 15 to 57 years. They were divided in 67 dysplastic joints free of pain and 131 dysplastic joints having pain. 50 normal joints were evaluated for comparison.
| ACM angle | > 49° |
| CE angle | > 30° |
| MZ distance | < 7mm |
| Hip value | = 16 |
No deformation was stated at the values shown in Table 13.
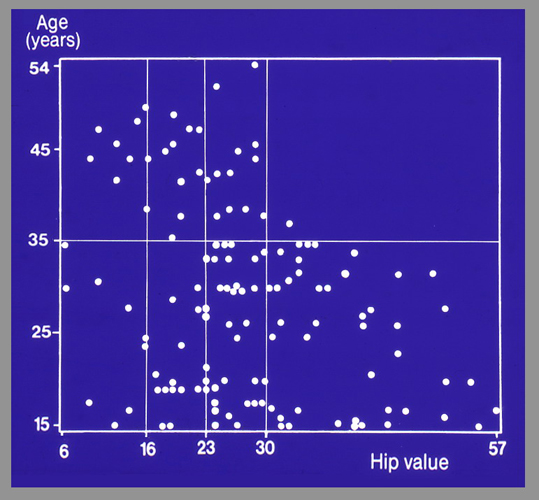 In this figure we correlate the time of the beginning of pain with the degree of deformation of a joint measured by the Hip Value. The range of the Hip Value, seen underneath, is 6 to 16. At 6 we find already pathologic deep joints. Up from Hip Value 16 the joints are dysplastic, slightly until about 23, severly until 30 and after 30 extremely deformed.
In the normal field there should actually be no painful joints. Besides the 2 deep joints at almost hip value 6, the others may have deformities of anteversion which we did not diagnose at that time.
The joints between Hip Value 16 and 23, which are only moderately deformed, experience pain later in life as we would expect, but also early. Between Hip Value 23 and 30, the severely deformed joints, in two thirds feel pain before age 35, but one third late in life. And only the extremely deformed joints with Hip Values higher than 30 experience pain regularly up to 35 years.
That means, in the moderately deformed joints, there is no definite correlation to the age of onset of pain. It becomes more strict, the more deformed the joint is, especially at hip value 30.
| Parameter | Critical range | Onset of pain |
|---|---|---|
CE angle |
10° - 0° |
up to 35 years |
CE angle |
< 0° |
by age 20 years |
ACM angle |
> 55° |
up to 35 years |
Distance MZ |
> 14mm |
35 years |
Hip value |
> 32 |
35 years |
Sharp angle |
> 47° |
35 years |
Entry angle |
< 75° |
40 years |
In Table 14 the different measurements are listed that anticipate an early onset of pain before the age of 35 years. For the CE angle this range are 0 - 10°. A hip with an angle below zero usually gets pain already by age 20.
For the torsional anomalies of the hip we can demonstrate only the age distribution of our material. As mentioned already, a severe decrease in anteversion may already at 10-12 years of age cause pain and discomfort with the externally rotatated femur. The most patients came for therapy between 20 and 30 years. The older age groups here are certainly underrepresented in this graph, because we did not include severe forms of osteoarthrosis with contractures that needed a total hip prosthesis.
For reconstructive surgery of the hip after cessation of growth we tell the patients to come when pain at long walks and increased physical stress is noted. The results of corrective operations are better in long-term follow-ups, if no arthrosis is present preoperatively. During growth in adolescents, however, a joint can be further deformed without pain. In this case earlier operations are necessary.
Detailed measurements of the hip are not very popular, and for a long time, only the CE angle of Wiberg had been used and descriptive classifications. But I believe this time has passed and we gain much more informations by different measurements and in 3 planes, with clear definitions of normal and pathological angles for diagnosis, and for starting and ending conservative and operative therapy. I hope you agree, thank you !
| Download | |
|---|---|
| Evaluation of Normal Values of the Hip and the Prognosis of Deformed Joints | PDF (x.x MB) |